The National Institutes of Health is beginning a handful of studies to test possible treatments for long COVID, an anxiously awaited step in U.S. efforts against the mysterious condition that afflicts millions.
Monday’s announcement from the NIH’s $1.15 billion RECOVER project comes amid frustration from patients who’ve struggled for months or even years with sometimes-disabling health problems — with no proven treatments and only a smattering of rigorous studies to test potential ones.
“This is a year or two late and smaller in scope than one would hope but nevertheless it’s a step in the right direction,” said Dr. Ziyad Al-Aly of Washington University in St. Louis, who isn’t involved with NIH’s project but whose own research highlighted long COVID’s toll. Getting answers is critical, he added, because “there’s a lot of people out there exploiting patients’ vulnerability” with unproven therapies.
Scientists don’t yet know what causes long COVID, the catchall term for about 200 widely varying symptoms. Between 10% and 30% of people are estimated to have experienced some form of long COVID after recovering from a coronavirus infection, a risk that has dropped somewhat since early in the pandemic.
“If I get 10 people, I get 10 answers of what long COVID really is,” U.S. Health and Human Services Secretary Xavier Becerra said.
That’s why so far the RECOVER initiative has tracked 24,000 patients in observational studies to help define the most common and burdensome symptoms –- findings that now are shaping multipronged treatment trials. The first two will look at:
— Whether taking up to 25 days of Pfizer’s antiviral drug Paxlovid could ease long COVID, because of a theory that some live coronavirus, or its remnants, may hide in the body and trigger the disorder. Normally Paxlovid is used when people first get infected and for just five days.
— Treatments for “brain fog” and other cognitive problems. They include Posit Science Corp.’s BrainHQ cognitive training program, another called PASC-Cognitive Recovery by New York City’s Mount Sinai Health System, and a Soterix Medical device that electrically stimulates brain circuits.
Two additional studies will open in the coming months. One will test treatments for sleep problems. The other will target problems with the autonomic nervous system — which controls unconscious functions like breathing and heartbeat — including the disorder called POTS.
A more controversial study of exercise intolerance and fatigue also is planned, with NIH seeking input from some patient groups worried that exercise may do more harm than good for certain long COVID sufferers.
The trials are enrolling 300 to 900 adult participants for now but have the potential to grow. Unlike typical experiments that test one treatment at a time, these more flexible “platform studies” will let NIH add additional potential therapies on a rolling basis.
“We can rapidly pivot,” Dr. Amy Patterson with the NIH explained. A failing treatment can be dropped without ending the entire trial and “if something promising comes on the horizon, we can plug it in.”
The flexibility could be key, according to Dr. Anthony Komaroff, a Harvard researcher who isn’t involved with the NIH program but has long studied a similarly mysterious disorder known as chronic fatigue syndrome or ME/CFS. For example, he said, the Paxlovid study “makes all sorts of sense,” but if a 25-day dose shows only hints of working, researchers could extend the test to a longer course instead of starting from scratch.
Komaroff also said that he understands people’s frustration over the wait for these treatment trials, but believes NIH appropriately waited “until some clues came in about the underlying biology,” adding: “You’ve got to have targets.”
___
The Associated Press Health and Science Department receives support from the Howard Hughes Medical Institute’s Science and Educational Media Group. The AP is solely responsible for all content.
When it comes to respecting your body and that of your partner, one of the most important acts of care you can offer, aside from practicing safe sex, is talking frankly about STIs.
Sexually transmitted infections have long been deeply stigmatized, but understanding their risks is crucial for sexual wellness.
To better understand the landscape of STI prevalence across the U.S., Stacker investigated which states have the highest incidence of STIs using 2021 data from the CDC. States are ranked by overall STI cases per 100,000. The total number of cases breaks ties. Maryland is excluded from the list because it did not report STI data to the CDC.
An infection is considered an STI if it can be passed from person to person through sexual intercourse, including anal, oral, vaginal, and occasionally hand-to-genital contact. Some common symptoms of STIs include pain during urination, unusual genital discharge, lumps or growths near the genitals, bleeding, and itching. This list is not exhaustive; most people who contract STIs are asymptomatic.
Regular testing at your local health clinic, even when you don’t have symptoms, is the best way to keep yourself safe from current and future STIs. While STIs can be scary, they can be prevented by engaging in safe sex practices, such as the use of condoms, internal condoms, and dental dams. Many STIs, like chlamydia and gonorrhea, are treatable with medication when caught early. Routine testing and honest dialogue with partners makes that possible.
Read on to see how the incidence of STIs in your state compares to other states around the nation.
Sean Pavone // Shutterstock
#49. Vermont
– Total STI rate per 100,000: 163.2 (1,056 cases)
— Chlamydia rate per 100,000: 140.7 (910 cases)
— Gonorrhea rate per 100,000: 21.0 (136 cases)
— Primary and secondary syphilis rate per 100,000: 1.4 (9 cases)
— Congenital syphilis rate per 100,000: 0.2 (1 cases)
Sean Pavone // Shutterstock
#48. New Hampshire
– Total STI rate per 100,000: 267.6 (3,713 cases)
— Chlamydia rate per 100,000: 218.2 (3,027 cases)
— Gonorrhea rate per 100,000: 44.2 (613 cases)
— Primary and secondary syphilis rate per 100,000: 5.3 (73 cases)
— Congenital syphilis rate per 100,000: 0.0 (0 cases)
Sean Pavone // Shutterstock
#47. Maine
– Total STI rate per 100,000: 282.8 (3,895 cases)
— Chlamydia rate per 100,000: 244.8 (3,372 cases)
— Gonorrhea rate per 100,000: 33.5 (462 cases)
— Primary and secondary syphilis rate per 100,000: 4.4 (61 cases)
— Congenital syphilis rate per 100,000: 0.0 (0 cases)
Sean Pavone // Shutterstock
#46. West Virginia
– Total STI rate per 100,000: 397.2 (7,092 cases)
— Chlamydia rate per 100,000: 292.7 (5,226 cases)
— Gonorrhea rate per 100,000: 91.8 (1,639 cases)
— Primary and secondary syphilis rate per 100,000: 11.9 (212 cases)
— Congenital syphilis rate per 100,000: 0.8 (15 cases)
Charles Knowles // Shutterstock
#45. Idaho
– Total STI rate per 100,000: 399.4 (7,606 cases)
— Chlamydia rate per 100,000: 331.9 (6,320 cases)
— Gonorrhea rate per 100,000: 62.9 (1,197 cases)
— Primary and secondary syphilis rate per 100,000: 4.4 (84 cases)
— Congenital syphilis rate per 100,000: 0.3 (5 cases)
Johnny Adolphson // Shutterstock
#44. Utah
– Total STI rate per 100,000: 450.7 (15,049 cases)
— Chlamydia rate per 100,000: 336.0 (11,221 cases)
— Gonorrhea rate per 100,000: 108.4 (3,621 cases)
— Primary and secondary syphilis rate per 100,000: 6.1 (205 cases)
— Congenital syphilis rate per 100,000: 0.1 (2 cases)
f11photo // Shutterstock
#43. Wyoming
– Total STI rate per 100,000: 451.6 (2,617 cases)
— Chlamydia rate per 100,000: 358.6 (2,078 cases)
— Gonorrhea rate per 100,000: 90.3 (523 cases)
— Primary and secondary syphilis rate per 100,000: 2.8 (16 cases)
— Congenital syphilis rate per 100,000: 0.0 (0 cases)
mandritoiu // Shutterstock
#42. New Jersey
– Total STI rate per 100,000: 481.7 (44,640 cases)
— Chlamydia rate per 100,000: 360.7 (33,425 cases)
— Gonorrhea rate per 100,000: 110.7 (10,259 cases)
— Primary and secondary syphilis rate per 100,000: 9.8 (908 cases)
— Congenital syphilis rate per 100,000: 0.5 (48 cases)
EQRoy // Shutterstock
#41. Montana
– Total STI rate per 100,000: 504.6 (5,582 cases)
— Chlamydia rate per 100,000: 364.2 (4,029 cases)
— Gonorrhea rate per 100,000: 130.9 (1,448 cases)
— Primary and secondary syphilis rate per 100,000: 8.7 (96 cases)
— Congenital syphilis rate per 100,000: 0.8 (9 cases)
Tono Balaguer // Shutterstock
#40. Massachusetts
– Total STI rate per 100,000: 514.2 (35,940 cases)
— Chlamydia rate per 100,000: 385.6 (26,950 cases)
— Gonorrhea rate per 100,000: 117.9 (8,240 cases)
— Primary and secondary syphilis rate per 100,000: 10.6 (741 cases)
— Congenital syphilis rate per 100,000: 0.1 (9 cases)
Nadia Yong // Shutterstock
#39. Oregon
– Total STI rate per 100,000: 535.5 (22,793 cases)
— Chlamydia rate per 100,000: 366.4 (15,596 cases)
— Gonorrhea rate per 100,000: 146.2 (6,221 cases)
— Primary and secondary syphilis rate per 100,000: 22.3 (949 cases)
— Congenital syphilis rate per 100,000: 0.6 (27 cases)
SvetlanaSF // Shutterstock
#38. Hawaii
– Total STI rate per 100,000: 540.0 (7,814 cases)
— Chlamydia rate per 100,000: 420.0 (6,078 cases)
— Gonorrhea rate per 100,000: 100.7 (1,457 cases)
— Primary and secondary syphilis rate per 100,000: 17.9 (259 cases)
— Congenital syphilis rate per 100,000: 1.4 (20 cases)
Nadia Yong // Shutterstock
#37. Washington
– Total STI rate per 100,000: 548.0 (42,422 cases)
— Chlamydia rate per 100,000: 382.8 (29,632 cases)
— Gonorrhea rate per 100,000: 145.1 (11,231 cases)
— Primary and secondary syphilis rate per 100,000: 19.5 (1,506 cases)
— Congenital syphilis rate per 100,000: 0.7 (53 cases)
Sean Pavone // Shutterstock
#36. Pennsylvania
– Total STI rate per 100,000: 563.8 (73,360 cases)
— Chlamydia rate per 100,000: 408.3 (53,124 cases)
— Gonorrhea rate per 100,000: 145.3 (18,912 cases)
— Primary and secondary syphilis rate per 100,000: 10.1 (1,310 cases)
— Congenital syphilis rate per 100,000: 0.1 (14 cases)
Sean Pavone // Shutterstock
#35. Connecticut
– Total STI rate per 100,000: 565.5 (20,490 cases)
— Chlamydia rate per 100,000: 407.1 (14,750 cases)
— Gonorrhea rate per 100,000: 149.2 (5,405 cases)
— Primary and secondary syphilis rate per 100,000: 9.1 (329 cases)
— Congenital syphilis rate per 100,000: 0.2 (6 cases)
photo.ua // Shutterstock
#34. Minnesota
– Total STI rate per 100,000: 574.5 (32,813 cases)
— Chlamydia rate per 100,000: 395.2 (22,573 cases)
— Gonorrhea rate per 100,000: 169.1 (9,660 cases)
— Primary and secondary syphilis rate per 100,000: 9.9 (565 cases)
— Congenital syphilis rate per 100,000: 0.3 (15 cases)
Felix Mizioznikov // Shutterstock
#33. Kentucky
– Total STI rate per 100,000: 604.9 (27,259 cases)
— Chlamydia rate per 100,000: 410.5 (18,500 cases)
— Gonorrhea rate per 100,000: 182.4 (8,221 cases)
— Primary and secondary syphilis rate per 100,000: 11.4 (513 cases)
— Congenital syphilis rate per 100,000: 0.6 (25 cases)
Scruggelgreen // Shutterstock
#32. Nebraska
– Total STI rate per 100,000: 618.6 (12,146 cases)
— Chlamydia rate per 100,000: 453.1 (8,897 cases)
— Gonorrhea rate per 100,000: 156.0 (3,063 cases)
— Primary and secondary syphilis rate per 100,000: 9.4 (185 cases)
— Congenital syphilis rate per 100,000: 0.1 (1 cases)
Sean Pavone // Shutterstock
#31. Virginia
– Total STI rate per 100,000: 641.0 (55,495 cases)
— Chlamydia rate per 100,000: 466.8 (40,409 cases)
— Gonorrhea rate per 100,000: 165.4 (14,323 cases)
— Primary and secondary syphilis rate per 100,000: 8.6 (745 cases)
— Congenital syphilis rate per 100,000: 0.2 (18 cases)
Jim Schubert // Shutterstock
#30. Rhode Island
– Total STI rate per 100,000: 646.4 (7,091 cases)
— Chlamydia rate per 100,000: 473.9 (5,199 cases)
— Gonorrhea rate per 100,000: 153.2 (1,681 cases)
— Primary and secondary syphilis rate per 100,000: 19.1 (209 cases)
— Congenital syphilis rate per 100,000: 0.2 (2 cases)
Real Window Creative // Shutterstock
#29. Delaware
– Total STI rate per 100,000: 652.0 (6,551 cases)
— Chlamydia rate per 100,000: 485.7 (4,880 cases)
— Gonorrhea rate per 100,000: 153.4 (1,541 cases)
— Primary and secondary syphilis rate per 100,000: 12.8 (129 cases)
— Congenital syphilis rate per 100,000: 0.1 (1 cases)
Andrew Zarivny // Shutterstock
#28. Colorado
– Total STI rate per 100,000: 656.4 (38,145 cases)
— Chlamydia rate per 100,000: 460.3 (26,747 cases)
— Gonorrhea rate per 100,000: 182.3 (10,596 cases)
— Primary and secondary syphilis rate per 100,000: 13.3 (772 cases)
— Congenital syphilis rate per 100,000: 0.5 (30 cases)
Lindsay Snow // Shutterstock
#27. Wisconsin
– Total STI rate per 100,000: 663.9 (39,040 cases)
— Chlamydia rate per 100,000: 473.6 (27,847 cases)
— Gonorrhea rate per 100,000: 177.8 (10,455 cases)
— Primary and secondary syphilis rate per 100,000: 12.3 (723 cases)
— Congenital syphilis rate per 100,000: 0.3 (15 cases)
ehrlif // Shutterstock
#26. Michigan
– Total STI rate per 100,000: 681.9 (68,441 cases)
— Chlamydia rate per 100,000: 453.0 (45,473 cases)
— Gonorrhea rate per 100,000: 218.7 (21,954 cases)
— Primary and secondary syphilis rate per 100,000: 9.7 (972 cases)
— Congenital syphilis rate per 100,000: 0.4 (42 cases)
Paul Brady Photography // Shutterstock
#25. Iowa
– Total STI rate per 100,000: 699.7 (22,373 cases)
— Chlamydia rate per 100,000: 488.5 (15,620 cases)
— Gonorrhea rate per 100,000: 200.2 (6,403 cases)
— Primary and secondary syphilis rate per 100,000: 10.6 (339 cases)
— Congenital syphilis rate per 100,000: 0.3 (11 cases)
Sean Pavone // Shutterstock
#24. Florida
– Total STI rate per 100,000: 704.7 (153,816 cases)
— Chlamydia rate per 100,000: 478.3 (104,400 cases)
— Gonorrhea rate per 100,000: 205.0 (44,738 cases)
— Primary and secondary syphilis rate per 100,000: 20.6 (4,498 cases)
— Congenital syphilis rate per 100,000: 0.8 (180 cases)
Sean Pavone // Shutterstock
#23. Kansas
– Total STI rate per 100,000: 708.2 (20,805 cases)
— Chlamydia rate per 100,000: 505.5 (14,851 cases)
— Gonorrhea rate per 100,000: 192.2 (5,646 cases)
— Primary and secondary syphilis rate per 100,000: 10.2 (301 cases)
— Congenital syphilis rate per 100,000: 0.2 (7 cases)
Sean Pavone // Shutterstock
#22. Ohio
– Total STI rate per 100,000: 732.7 (86,192 cases)
— Chlamydia rate per 100,000: 480.4 (56,520 cases)
— Gonorrhea rate per 100,000: 236.6 (27,838 cases)
— Primary and secondary syphilis rate per 100,000: 15.2 (1,783 cases)
— Congenital syphilis rate per 100,000: 0.4 (51 cases)
Sean Pavone // Shutterstock
#21. Indiana
– Total STI rate per 100,000: 733.7 (49,992 cases)
— Chlamydia rate per 100,000: 510.1 (34,755 cases)
— Gonorrhea rate per 100,000: 212.6 (14,483 cases)
— Primary and secondary syphilis rate per 100,000: 10.8 (734 cases)
— Congenital syphilis rate per 100,000: 0.3 (20 cases)
Jacob Boomsma // Shutterstock
#20. North Dakota
– Total STI rate per 100,000: 739.1 (5,750 cases)
— Chlamydia rate per 100,000: 509.6 (3,964 cases)
— Gonorrhea rate per 100,000: 223.0 (1,735 cases)
— Primary and secondary syphilis rate per 100,000: 6.3 (49 cases)
— Congenital syphilis rate per 100,000: 0.3 (2 cases)
Sean Pavone // Shutterstock
#19. Texas
– Total STI rate per 100,000: 740.2 (218,804 cases)
— Chlamydia rate per 100,000: 506.2 (149,636 cases)
— Gonorrhea rate per 100,000: 218.6 (64,623 cases)
— Primary and secondary syphilis rate per 100,000: 13.1 (3,865 cases)
— Congenital syphilis rate per 100,000: 2.3 (680 cases)
Photo Spirit // Shutterstock
#18. New York
– Total STI rate per 100,000: 746.5 (148,246 cases)
— Chlamydia rate per 100,000: 511.9 (101,657 cases)
— Gonorrhea rate per 100,000: 216.8 (43,048 cases)
— Primary and secondary syphilis rate per 100,000: 17.6 (3,500 cases)
— Congenital syphilis rate per 100,000: 0.2 (41 cases)
TierneyMJ // Shutterstock
#17. California
– Total STI rate per 100,000: 746.6 (292,245 cases)
— Chlamydia rate per 100,000: 489.3 (191,542 cases)
— Gonorrhea rate per 100,000: 233.7 (91,461 cases)
— Primary and secondary syphilis rate per 100,000: 22.3 (8,724 cases)
— Congenital syphilis rate per 100,000: 1.3 (518 cases)
Sean Pavone // Shutterstock
#16. Missouri
– Total STI rate per 100,000: 794.4 (49,011 cases)
— Chlamydia rate per 100,000: 517.3 (31,915 cases)
— Gonorrhea rate per 100,000: 254.7 (15,714 cases)
— Primary and secondary syphilis rate per 100,000: 21.3 (1,316 cases)
— Congenital syphilis rate per 100,000: 1.1 (66 cases)
Paul Brady Photography // Shutterstock
#15. Oklahoma
– Total STI rate per 100,000: 809.1 (32,292 cases)
— Chlamydia rate per 100,000: 518.9 (20,709 cases)
— Gonorrhea rate per 100,000: 257.4 (10,273 cases)
— Primary and secondary syphilis rate per 100,000: 30.7 (1,225 cases)
— Congenital syphilis rate per 100,000: 2.1 (85 cases)
Marianna Ianovska // Shutterstock
#14. Illinois
– Total STI rate per 100,000: 818.4 (103,826 cases)
— Chlamydia rate per 100,000: 566.2 (71,836 cases)
— Gonorrhea rate per 100,000: 240.1 (30,454 cases)
— Primary and secondary syphilis rate per 100,000: 11.7 (1,486 cases)
— Congenital syphilis rate per 100,000: 0.4 (50 cases)
f11photo // Shutterstock
#13. Nevada
– Total STI rate per 100,000: 820.6 (25,820 cases)
— Chlamydia rate per 100,000: 519.6 (16,348 cases)
— Gonorrhea rate per 100,000: 269.8 (8,488 cases)
— Primary and secondary syphilis rate per 100,000: 29.8 (939 cases)
— Congenital syphilis rate per 100,000: 1.4 (45 cases)
CrackerClips Stock Media // Shutterstock
#12. Tennessee
– Total STI rate per 100,000: 846.5 (58,986 cases)
— Chlamydia rate per 100,000: 562.9 (39,227 cases)
— Gonorrhea rate per 100,000: 269.3 (18,768 cases)
— Primary and secondary syphilis rate per 100,000: 13.7 (952 cases)
— Congenital syphilis rate per 100,000: 0.6 (39 cases)
Charles T. Peden // Shutterstock
#11. Arizona
– Total STI rate per 100,000: 854.6 (62,087 cases)
— Chlamydia rate per 100,000: 571.2 (41,498 cases)
— Gonorrhea rate per 100,000: 253.6 (18,426 cases)
— Primary and secondary syphilis rate per 100,000: 27.3 (1,982 cases)
— Congenital syphilis rate per 100,000: 2.5 (181 cases)
turtix // Shutterstock
#10. New Mexico
– Total STI rate per 100,000: 864.0 (18,289 cases)
— Chlamydia rate per 100,000: 587.8 (12,441 cases)
— Gonorrhea rate per 100,000: 240.0 (5,080 cases)
— Primary and secondary syphilis rate per 100,000: 34.2 (724 cases)
— Congenital syphilis rate per 100,000: 2.1 (44 cases)
Derek Olson Photography // Shutterstock
#9. North Carolina
– Total STI rate per 100,000: 891.4 (94,184 cases)
— Chlamydia rate per 100,000: 602.5 (63,660 cases)
— Gonorrhea rate per 100,000: 270.8 (28,612 cases)
— Primary and secondary syphilis rate per 100,000: 17.7 (1,870 cases)
— Congenital syphilis rate per 100,000: 0.4 (42 cases)
Sean Pavone // Shutterstock
#8. Arkansas
– Total STI rate per 100,000: 896.7 (27,152 cases)
— Chlamydia rate per 100,000: 592.3 (17,936 cases)
— Gonorrhea rate per 100,000: 270.0 (8,176 cases)
— Primary and secondary syphilis rate per 100,000: 32.7 (990 cases)
— Congenital syphilis rate per 100,000: 1.7 (50 cases)
Sean Pavone // Shutterstock
#7. Georgia
– Total STI rate per 100,000: 944.7 (101,914 cases)
— Chlamydia rate per 100,000: 629.8 (67,941 cases)
— Gonorrhea rate per 100,000: 296.6 (31,996 cases)
— Primary and secondary syphilis rate per 100,000: 17.5 (1,884 cases)
— Congenital syphilis rate per 100,000: 0.9 (93 cases)
Sopotnicki // Shutterstock
#6. South Dakota
– Total STI rate per 100,000: 955.5 (8,563 cases)
— Chlamydia rate per 100,000: 541.5 (4,853 cases)
— Gonorrhea rate per 100,000: 363.5 (3,258 cases)
— Primary and secondary syphilis rate per 100,000: 48.7 (436 cases)
— Congenital syphilis rate per 100,000: 1.8 (16 cases)
Kevin Ruck // Shutterstock
#5. Alabama
– Total STI rate per 100,000: 960.3 (48,496 cases)
— Chlamydia rate per 100,000: 623.9 (31,507 cases)
— Gonorrhea rate per 100,000: 320.6 (16,191 cases)
— Primary and secondary syphilis rate per 100,000: 15.1 (761 cases)
— Congenital syphilis rate per 100,000: 0.7 (37 cases)
f11photo // Shutterstock
#4. South Carolina
– Total STI rate per 100,000: 1,027.9 (53,384 cases)
— Chlamydia rate per 100,000: 702.4 (36,477 cases)
— Gonorrhea rate per 100,000: 309.1 (16,052 cases)
— Primary and secondary syphilis rate per 100,000: 16.1 (836 cases)
— Congenital syphilis rate per 100,000: 0.4 (19 cases)
Daniel Case // Shutterstock
#3. Alaska
– Total STI rate per 100,000: 1,055.2 (7,747 cases)
— Chlamydia rate per 100,000: 758.8 (5,571 cases)
— Gonorrhea rate per 100,000: 269.3 (1,977 cases)
— Primary and secondary syphilis rate per 100,000: 26.4 (194 cases)
— Congenital syphilis rate per 100,000: 0.7 (5 cases)
Sean Pavone // Shutterstock
#2. Louisiana
– Total STI rate per 100,000: 1,107.7 (51,254 cases)
— Chlamydia rate per 100,000: 729.6 (33,759 cases)
— Gonorrhea rate per 100,000: 354.2 (16,390 cases)
— Primary and secondary syphilis rate per 100,000: 21.5 (995 cases)
— Congenital syphilis rate per 100,000: 2.4 (110 cases)
Sean Pavone // Shutterstock
#1. Mississippi
– Total STI rate per 100,000: 1,208.2 (35,636 cases)
— Chlamydia rate per 100,000: 750.1 (22,126 cases)
— Gonorrhea rate per 100,000: 427.8 (12,617 cases)
— Primary and secondary syphilis rate per 100,000: 28.1 (829 cases)
— Congenital syphilis rate per 100,000: 2.2 (64 cases)
A U.K. court on Thursday rejected the British government’s request to keep former Prime Minister Boris Johnson’s unredacted WhatsApp messages and diaries from being made public at an official COVID-19 inquiry.
The Cabinet Office took the unusual step of bringing a legal challenge after the retired judge chairing the inquiry into Britain’s handling of the coronavirus pandemic ordered the Conservative government to release full copies of Johnson’s documents.
Government officials argued the inquiry did not have the legal power to force them to release documents and messages that they said were “unambiguously irrelevant” to how the government handled COVID-19.
But lawyers for the inquiry said the idea that civil servants could decide what material was relevant would undermine public confidence in the process.
The judges who ruled in the Cabinet Office’s case said Johnson’s diaries and notebooks were “very likely to contain information about decision-making” relating to the pandemic.
A spokesperson said the government would comply fully with the ruling and work with the inquiry to ensure the privacy of involved individuals is protected.
Johnson, who was prime minister during the COVID-19 pandemic, agreed in late 2021 to hold an inquiry into how the government handled the spread of the virus.
Johnson handed over some of his unredacted notebooks along with diaries and WhatsApp messages to the inquiry in late May.
COVID-19 was recorded as a cause of death for almost 227,000 people in the U.K., one of the highest pandemic death tolls in Europe. The bereaved families of some of the people who died pressured the government to authorize an inquiry.
Heather Hallett, the retired judge leading the investigation, has the power to summon witnesses, including senior politicians, to testify under oath at public hearings.
The COVID-19 Bereaved Families for Justice group said it was a “disgrace” that the Cabinet Office tried to obstruct the work of the inquiry.
“This judicial review was a desperate waste of time and money. The inquiry needs to get to the facts if the country is to learn lessons that will save lives in the future,” the group’s spokesperson, Deborah Doyle, said.
China reported Thursday that 239 people died from COVID-19 in June in a significant uptick months after it lifted most containment measures.
The Chinese Center for Disease Control and Prevention had reported 164 deaths in May and none at all in April and March.
China started employing a “zero-COVID” containment strategy in early 2020 and credits the strict lockdowns, quarantines, border closures and compulsory mass testing with significantly saving lives.
But the measures were lifted suddenly in December with little preparation, leading to a final surge in which about 60,000 people died, according to the official toll. Deaths this year peaked in January and February, hitting a high of 4,273 on Jan, 4, but then declined gradually to zero on Feb. 23, according to the Chinese CDC.
Chinese health officials didn’t say whether they expect the trend to continue or if they would recommend for preventative measures to be restored.
Two of the deaths in June were from respiratory failure caused by infection, while the CDC said the others involved underlying conditions. Those can include diabetes, heart disease, high blood pressure and other chronic illnesses.
Between Jan. 3, 2020, and July 5, 2023, China reported 99,292,081 confirmed cases of COVID-19 and 121,490 deaths to the World Health Organization.
Experts estimate that many hundreds of thousands of people, perhaps more, may have died in China — far higher than the official toll, but still a significantly lower death rate than in the United States and Europe.
The Spanish government on Tuesday declared an end to the health crisis caused by the COVID-19 pandemic, and says people no longer have to wear masks in health and care centers as well as pharmacies.
Over the past two years, Spain has gradually ended the mandatory mask wearing, first in public and then on public transport.
The country has registered 14 million cases and 122,000 deaths from the coronavirus since 2020.
The government approved the measure at a weekly Cabinet meeting. It takes effect once it’s published in the State Gazette in the coming days.
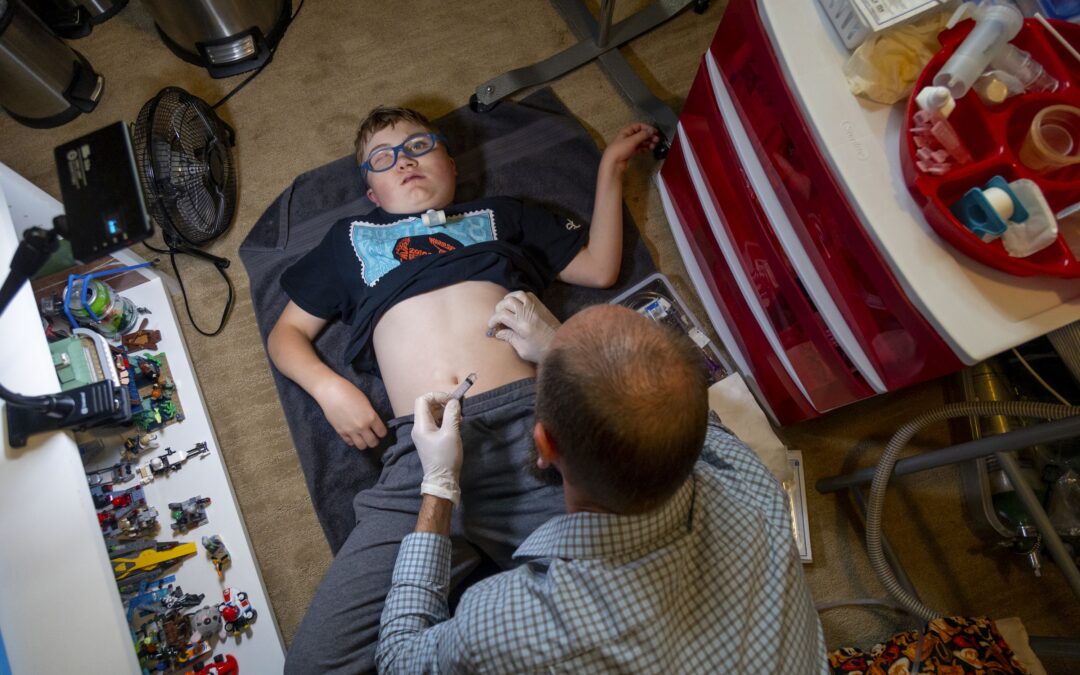
Nathan Hill started receiving $12.75 an hour from a state Medicaid program to help care for his severely disabled son during the pandemic, money he said allowed his family to stop using food stamps.
The program was designed to provide a continuation of care and ease a home health worker shortage that grew worse after COVID-19 hit.
But now, with the COVID-19 public health emergency over, he worries that the extra income will disappear. Some states have already stopped payments while others have yet to make them permanent.
“The success of this during the pandemic was tremendous … for the first time we were able to pay our own way,” said the Meridian, Idaho, resident. “We’re not relying on charities to help us pay our rent and utilities.”
A total of 39 states, with the help of the federal government, either started paying family caregivers or expanded the population eligible for payment during the pandemic, according to a survey last summer by KFF, a non-profit that studies health care issues.
Depending on the state, family caregivers were paid for helping people with intellectual or physical disabilities, medically fragile children or patients dealing with traumatic brain or spinal cord injuries. Details like pay rates and who could be paid varied.
“For each state, there’s a different story as to how this played out,” said Alice Burns, associate director of KFF’s program on Medicaid and the uninsured.
Researchers say there are no good national estimates for how many family caregivers started receiving payments during the pandemic.
About 53 million people provided care for family members with medical problems or disabilities, according to a 2020 report from AARP and the National Alliance for Caregiving.
Those who got paychecks during the public health emergency say the money reduced financial stress, helped provide care and gave dignity to their previously unpaid work.
Jessa Reinhardt and her husband, Jason, each received $24 an hour to provide care for their autistic daughters, ages 8 and 5. The Vernonia, Oregon, couple could not provide care at the same time.
The money allowed the family to build some savings since Jason quit his job several years ago to become a caregiver. It also allowed them to start taking the girls on outings to socialize them. They would make regular trips to Walmart so the girls could learn how to make choices and pick out a small item to buy.
But they had to curtail that once their payments ended in May. Jessa Reinhardt said the girls will still want to buy something.
“We can’t always say yes to that,” she said.
While some states have ended caregiver payments for now, federal officials say several states are still considering their next steps. Laws and waivers that regulate who can receive caregiver payments after the public health emergency may make it challenging for some to continue payments.
Federal officials say they are encouraging states to continue family caregiver payments.
States found that being flexible with caregiver payments helped keep residents served during the pandemic, said Kate McEvoy, executive director of the National Association of Medicaid Directors. She said surveys have shown, too, that people generally like receiving care from family members.
But she also noted that there are concerns both nationally and at a state level about the potential for fraud when paying family members as opposed to an agency that may be subject to more oversight. States also want to make sure that any family caregivers are trained properly and provide quality care.
Idaho Medicaid administrator Juliet Charron said the state was working to continue reimbursement for parents and spouses who provide care. But she added that the program will “likely look a bit different from the flexibility that has been in place” during the public health emergency.
Hill expects his program will last a few more months.
He was paid during the pandemic to provide non-nursing care like bathing and changing Brady, who needs around-the-clock care after surviving a rare brain cancer diagnosed at just 14 months old. He says he has no nursing degree or certification but has training and years of experience. His work is monitored by a supervising nurse.
Both Hill and Reinhardt say they can’t simply bring in a state-funded outside caregiver to help.
Hill has nurses come in to monitor his son on most overnights, but he delivers care during the day. Hill says caregivers are hard to find and quick to leave. He figures that the family has probably gone through around 50 nurses in the past 13 years.
He says each new one takes a few weeks to train, and then they frequently leave for a job with better pay.
Reinhardt said bringing in help is too challenging partially because one of her daughters deals with severe anxiety. If an outside caregiver is late or calls in sick, their daughter may take days to recover from the disruption.
“There’s no replacement for my husband and I,” she said.
Even if outside caregivers were viable for these families, there might be a wait to get one.
More than 650,000 people were on waiting lists for home and community-based services in 2021, according to another KFF report. Who winds up on that list can depend on factors like worker shortages, the number of available services and whether states check patients on the list for eligibility.
Family caregivers can provide more consistent care and have better long-term knowledge of their patients than someone who comes in from the outside, noted Holly Carmichael, CEO of GT Independence, a Sturgis, Michigan, company that manages financial services for people with disabilities.
“You provide better services to someone you love and care about,” said Carmichael, whose daughter was born with a rare congenital disease. “They’re part of your life versus a job.”
Carmichael’s firm helps people do background checks on potential caregivers and then does payroll, tax withholdings and other paperwork once they are hired.
She said it makes no sense to end payments to family caregivers.
“We have a shortage of caregivers in our country,” Carmichael said. “We need to be pulling every lever we can.”